

The Current Real Estate Market vs. The 2008 Housing Crash
Many people remember The Great Recession, also known as the 2008 Housing Crash. Given the likelihood that we are heading into another recession(if we are not already in one), people are concerned that home prices will go down 20% or more in the coming months or years.
The “United States housing bubble” was a real estate bubble affecting over half of the U.S. states. Housing prices peaked in early 2006, started to decline in 2006 and 2007, and reached new lows in 2012.
On December 30, 2008, the Case–Shiller home price index reported its largest price drop in its history. The credit crisis resulting from the bursting of the housing bubble is an important cause of the 2007–2009 recession in the United States.
Increased foreclosure rates in 2006–2007 among U.S. homeowners led to a crisis in August 2008.
In many markets in the United States home prices fell by 20% or more. (*note: single family rental properties actually increased in value in most sectors during this time, reenforcing why real estate can be a great investment during a recession.)
There are several reasons that the current economic recession is different than the 2008 Housing Crash.
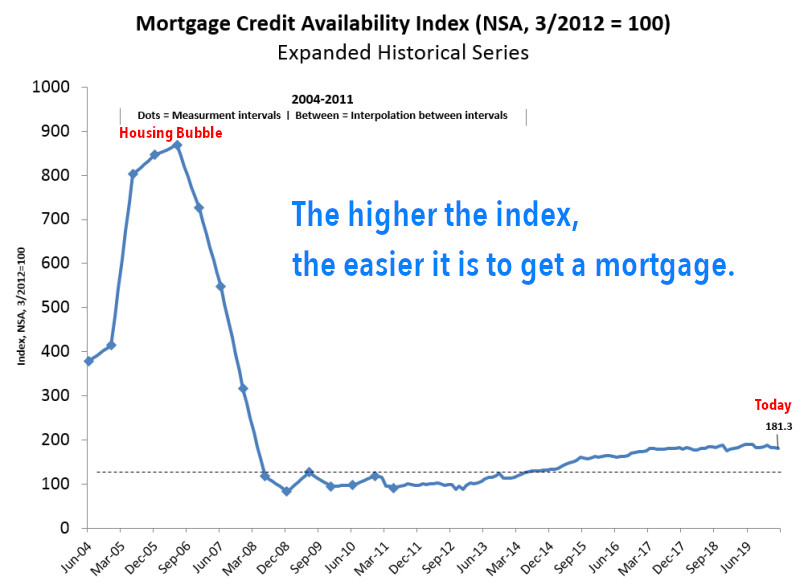
Source: Mortgage Bankers Association; Powered by Ellie Mae’s AllRegs® Market Clarity® Data prior to 3/31/2011 was generated using less frequent and less complete data measured at 6-month intervals interpolated in the months between for charting purposes. Looking at a chart of the Mortgage Availability Index you can see that it was very easy for borrowers to obtain a mortgage. As such, the health of the existing mortgages in the market is much better. This, combined with the equity that owners have in homes that are financed(discussed later in this article) mean that homeowners will be less likely to default on mortgages.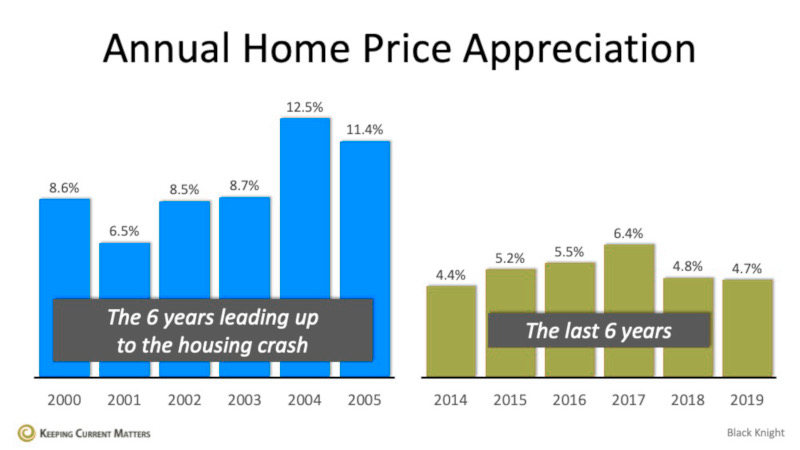
Source: Keeping Current Matters Looking at the sales history of Single Family Homes in Bozeman you can see that home prices were appreciating at over 13% per year prior to the correction that began in 2007. It is interesting to see that the number of homes sold started to decline in 2005 as prospective buyers started realising that homes were overpriced. From the peak in 2006 to the bottom in 2011 median price declined 25.4% and prices didn’t get back to new highs until 2015.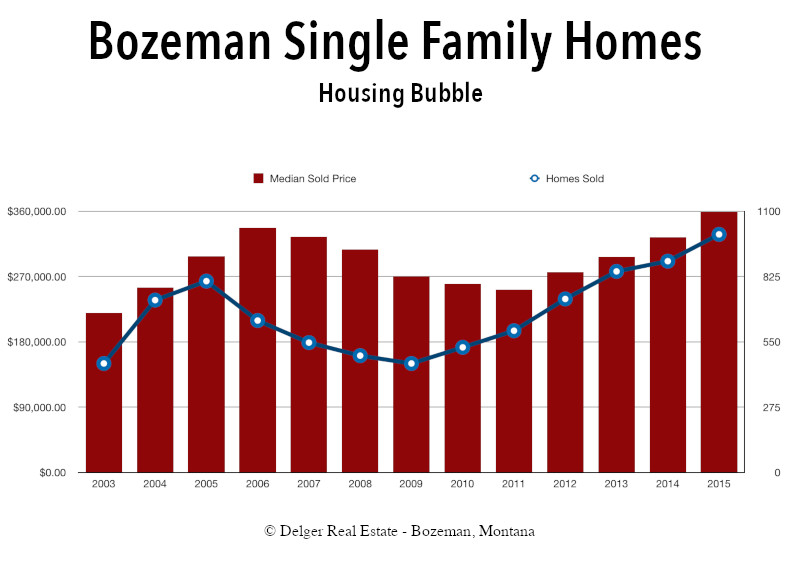
There’s a stark difference between these two periods of time. Normal appreciation is 3.6%, so while current appreciation is higher than the historic norm, it’s certainly not accelerating beyond control as it did in the early 2000s.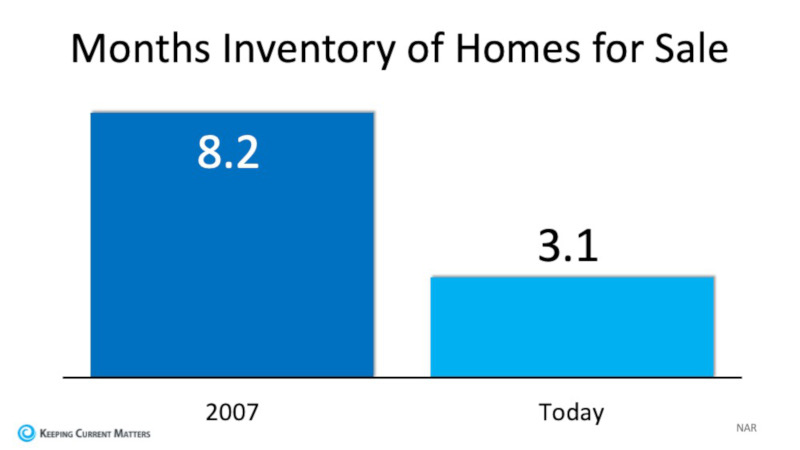
Source: Keeping Current Matters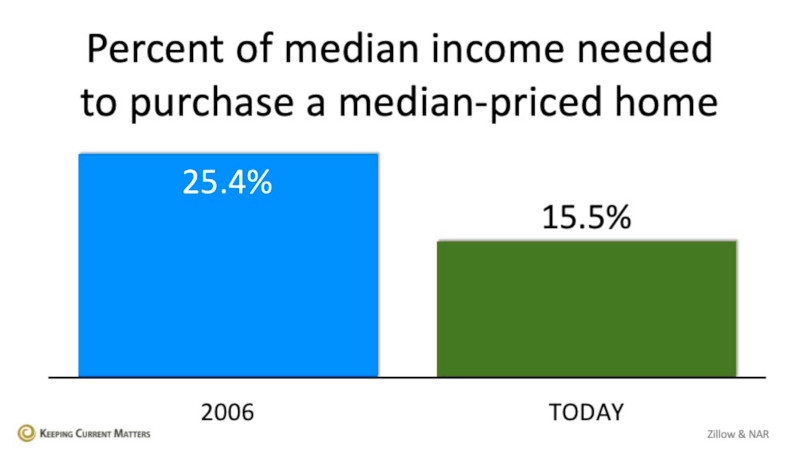
Source: Keeping Current Matters
1: Mortgages Have Been Much More Difficult To Get Now vs. Then
The Mortgage Credit Availability Index (MCAI) is a barometer on the availability of mortgage credit using guidelines from institutional investors who purchase loans through the broker and/ or correspondent channels. The higher the index the easier it is for borrowers to get loans. The lower the index, the more difficult it is for borrowers to obtain a loan.
Source: Mortgage Bankers Association; Powered by Ellie Mae’s AllRegs® Market Clarity® Data prior to 3/31/2011 was generated using less frequent and less complete data measured at 6-month intervals interpolated in the months between for charting purposes. Looking at a chart of the Mortgage Availability Index you can see that it was very easy for borrowers to obtain a mortgage. As such, the health of the existing mortgages in the market is much better. This, combined with the equity that owners have in homes that are financed(discussed later in this article) mean that homeowners will be less likely to default on mortgages.
2: Real Estate Is Priced Closer To True Market Value
Below is a graph showing annual house appreciation over the past six years, compared to the six years leading up to the height of the housing bubble. Though price appreciation has been quite strong recently, it is nowhere near the rise in prices that preceded the crash.
Source: Keeping Current Matters Looking at the sales history of Single Family Homes in Bozeman you can see that home prices were appreciating at over 13% per year prior to the correction that began in 2007. It is interesting to see that the number of homes sold started to decline in 2005 as prospective buyers started realising that homes were overpriced. From the peak in 2006 to the bottom in 2011 median price declined 25.4% and prices didn’t get back to new highs until 2015.
There’s a stark difference between these two periods of time. Normal appreciation is 3.6%, so while current appreciation is higher than the historic norm, it’s certainly not accelerating beyond control as it did in the early 2000s.
We Have A Shortage Of Homes For Sale Today
The months’ supply of inventory needed to sustain a normal real estate market is approximately six months. Anything more than that is an overabundance and will causes prices to depreciate. Anything less than that is a shortage and will lead to continued appreciation. As the next graph shows, there were too many homes for sale in 2007, and that caused prices to tumble. Today, there’s a shortage of inventory which is causing an acceleration in home values.
Source: Keeping Current Matters
Houses Are More Affordable Today vs. Then
The affordability formula has three components: the price of the home, the wages earned by the purchaser, and the mortgage rate available at the time. Fourteen years ago, prices were high, wages were low, and mortgage rates were over 6%. Today, prices are still high. Wages, however, have increased and the mortgage rate is about 3.5%. That means the average family pays less of their monthly income toward their mortgage payment than they did back then. Here’s a graph showing that difference:
Source: Keeping Current Matters
Home Equity Is Much Higher Now
In the run-up to the housing bubble, homeowners were using their homes as a personal ATM machine. Many immediately withdrew their equity once it built up, and they learned their lesson in the process. Prices have risen nicely over the last few years, leading to over fifty percent of homes in the country having greater than 50% equity. But owners have not been tapping into it like the last time. Here is a table comparing the equity withdrawal over the last three years compared to 2005, 2006, and 2007. Homeowners have cashed out over $500 billion dollars less than before. During the crash, home values began to fall, and sellers found themselves in a negative equity situation (where the amount of the mortgage they owned was greater than the value of their home). Some decided to walk away from their homes, and that led to a rash of distressed property listings (foreclosures and short sales), which sold at huge discounts, thus lowering the value of other homes in the area. That can’t happen today.Category : Finance , Market Insights , Market Trends