

Bozeman Housing Bubble
Is Bozeman In A Housing Bubble
We are frequently asked this question and it is a common concern among buyers. Looking at the Median Price, and Price Per Square Foot charts in the Real Estate Market Reports in our Data Center it is easy to come to the conclusion that Bozeman is in a housing bubble because those charts indicate a steady increase in prices. This is a topic where many people have strong opinions. We would like to present you with some data, and have you draw your own conclusion.What Is A Housing Bubble
A housing bubble is a run-up in housing prices fueled by demand, speculation and exuberance. Housing bubbles usually start with an increase in demand, in the face of limited supply, which takes a relatively extended period to replenish and increase. Speculators enter the market, further driving up demand. At some point, demand decreases or stagnates at the same time supply increases, resulting in a sharp drop in prices, and the bubble bursts. The financial crisis of 2007–2008 was related to the bursting of a real estate bubble in the United State. This decline in real estate prices is still on the mind of many real estate buyers when they look at the recent price increases of houses in many markets like Bozeman.What Caused The Last Real Estate Bubble?
The wide spread decline of real estate prices in 2007–2008, and the run up in prices prior to the “bubble bursting” was caused by mortgage-backed securities created by hedge funds and banks. This was known as the Subprime Mortgage Crisis. The insurance companies covered them with credit default swaps. Demand for mortgages led to an asset bubble in housing because lenders gave mortgages to a large number of buyers that should not have qualified for those loans. During the Subprime Mortgage Crisis the Median Sales Price for Single Family Homes sold in Bozeman fell from $325,000 in 2007 to a low of $252,000 in 2011(a decline of 25.38%). Median Price Per Square Foot for Single Family Homes sold in Bozeman fell from $156.34 in 2007 to a low of $120.26 in 2011. That represents a decline of 23.08%.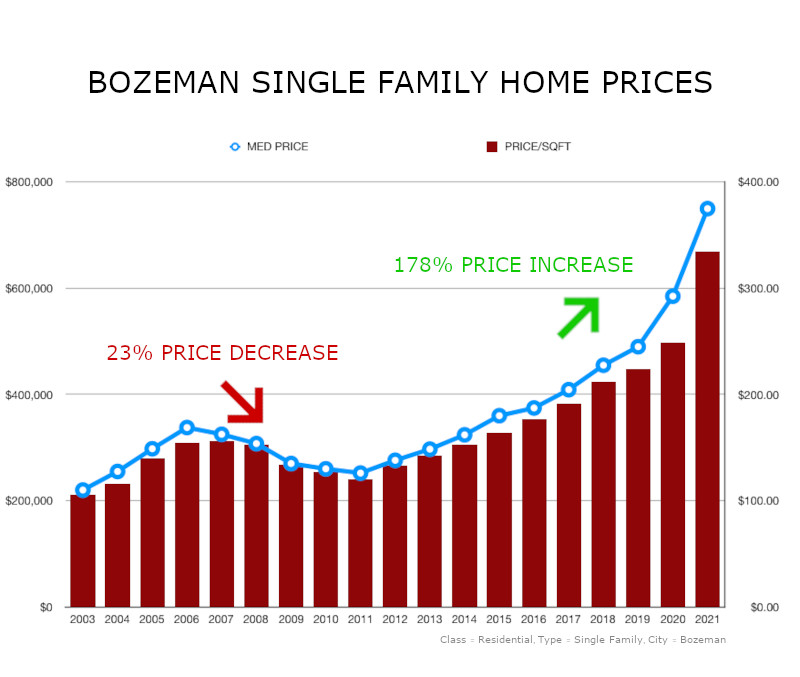 During the period from 2007 to 2011 many real estate markets in the United States had price declines of over 40%. Relative to those other real estate markets, prices of homes in Bozeman held up well.
Is Bozeman In Another Housing Bubble?
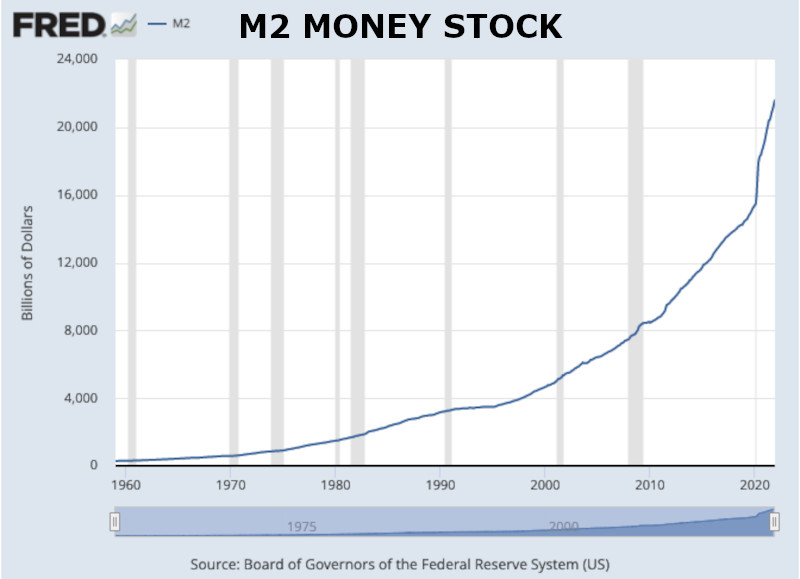
Many areas of the United States appear to be experiencing a housing bubble, or at least are experiencing Year Over Year declines in Median Sale Prices. Since 2013 prices for real estate in Bozeman and the surrounding areas have steadily gone up. However, this has been driven by good fundamentals of buyer demand combined with an ongoing lack of inventory and inflationary pressure. Mortgage companies are much more conservative on who they lend money to now. Median Sales Prices and Price Per Square Foot Prices in Bozeman are not currently declining and inventory levels remain at record lows. Looking at Bozeman Single Family Months Supply charts in our Real Estate Market Reports you will see that inventory levels for Bozeman Single Family Homes remain at record lows, and inventory levels for Bozeman Condominiums is still near record lows.Key Market Indicators
Just like the stock market, the Bozeman Real Estate Market is complicated, and highly dynamic. Some areas of the market may be experiencing weakness, while other areas continue to be strong. We encourage you to contact our agents to better understand what is happening in the specific neighborhoods and price points you are looking in. Our Bozeman Real Estate Experts look at 4 Key Market Indicators to determine if Bozeman is in a housing bubble.- House Price-Rent Ratio: The ratio of house prices to the annualized cost of rent.
- House Price-Income Ratio: The ratio of house prices to household income.
- Real House Prices: Housing prices adjusted for inflation.
- Credit To Households(% of GDP): Amount of debt held by households, compared to total economic output.
Predicting The Future
It is very difficult to predict with any certainty where Bozeman Real Estate prices will go in the future, at least in the short term. We like to avoid speculating about real estate prices with clients, preferring to discuss the relative data points. As this article has demonstrated, there are numerous factors and data points to consider but the two most important come down to the simple concept of Supply and Demand. Demand for real estate in Bozeman exceeds supply, and there are no indicators that this situation will change in the near future unless there is some large scale negative macro-economic event that wipes out demand from buyers. If we start to see a change in this basic equation we will update this article. If you have any questions on the information in this article, please do not hesitate to contact us. We are happy to go into more detail on any of the key metrics, and Real Estate Market Reports.Category : Bozeman Information , Buyer Information , Finance